Note
Go to the end to download the full example code.
DIC1#
Performs digital image correlation analyses on images obtained experimentally in this scientific article: https://univ-eiffel.hal.science/hal-05115523.
The images were downloaded from Recherche Data Gouv and are distributed under the Etalab Open License 2.0. For further details, see the DATA_LICENSE.md file.
Further implementation details are available in my PhD thesis (Section 2, Chapter 2, written in French).
ROI (691.458 ms)
N_x and N_y (93.371 ms)
Laplacian operator (2.950 ms)
Construct L and M (76.087 ms)
/img10.png
Iter 1 ||b|| 4.9e-02
Iter 2 ||b|| 1.9e-02
Iter 3 ||b|| 9.4e-03
Iter 4 ||b|| 4.8e-03
Iter 5 ||b|| 2.5e-03
Iter 6 ||b|| 1.3e-03
Iter 7 ||b|| 6.6e-04
Iter 8 ||b|| 3.5e-04
Iter 9 ||b|| 1.8e-04
Iter 10 ||b|| 9.4e-05
Iter 11 ||b|| 4.9e-05
Iter 12 ||b|| 2.6e-05
Iter 13 ||b|| 1.3e-05
Iter 14 ||b|| 7.0e-06
Iter 15 ||b|| 3.7e-06
Iter 16 ||b|| 1.9e-06
Iter 17 ||b|| 1.0e-06
Iter 18 ||b|| 5.3e-07
/img18.png
Iter 1 ||b|| 7.3e-02
Iter 2 ||b|| 1.2e-02
Iter 3 ||b|| 5.3e-03
Iter 4 ||b|| 2.5e-03
Iter 5 ||b|| 1.2e-03
Iter 6 ||b|| 5.7e-04
Iter 7 ||b|| 2.7e-04
Iter 8 ||b|| 1.3e-04
Iter 9 ||b|| 6.3e-05
Iter 10 ||b|| 3.0e-05
Iter 11 ||b|| 1.5e-05
Iter 12 ||b|| 7.1e-06
Iter 13 ||b|| 3.4e-06
Iter 14 ||b|| 1.7e-06
Iter 15 ||b|| 8.2e-07
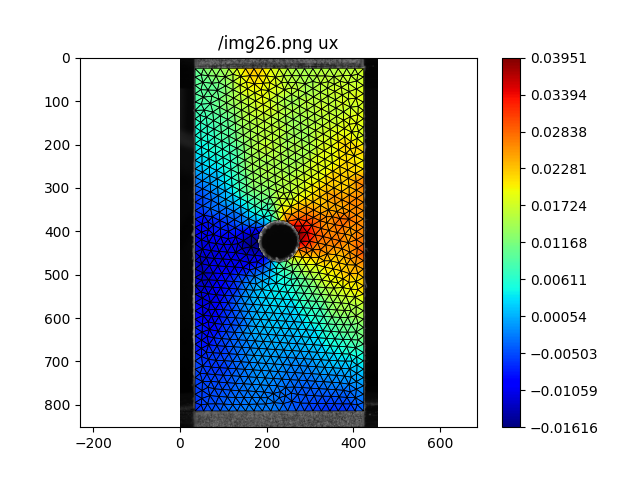
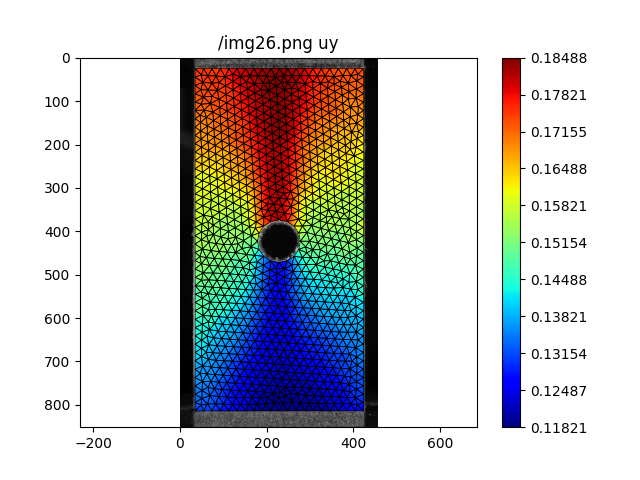
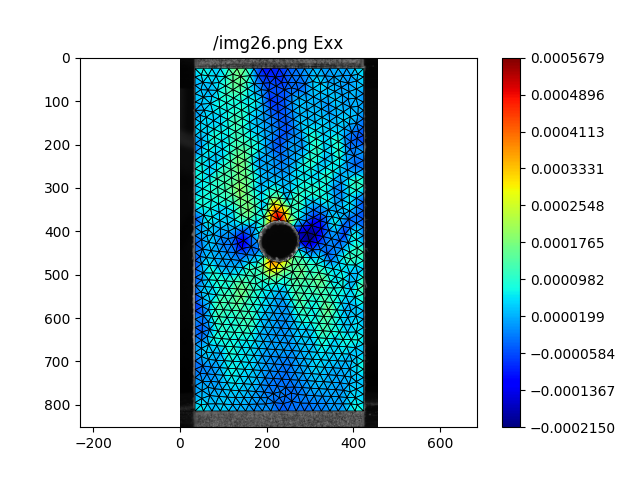
/img26.png
Iter 1 ||b|| 7.1e-02
Iter 2 ||b|| 4.0e-02
Iter 3 ||b|| 1.2e-02
Iter 4 ||b|| 5.4e-03
Iter 5 ||b|| 2.6e-03
Iter 6 ||b|| 1.2e-03
Iter 7 ||b|| 5.9e-04
Iter 8 ||b|| 2.8e-04
Iter 9 ||b|| 1.4e-04
Iter 10 ||b|| 6.7e-05
Iter 11 ||b|| 3.3e-05
Iter 12 ||b|| 1.6e-05
Iter 13 ||b|| 7.8e-06
Iter 14 ||b|| 3.8e-06
Iter 15 ||b|| 1.9e-06
Iter 16 ||b|| 9.2e-07
18 import matplotlib.pyplot as plt
19 from PIL import Image # matplotlib dependency
20 import numpy as np
21
22 from EasyFEA import Display, Folder, Models
23 from EasyFEA.Simulations import Elastic, DIC
24 from EasyFEA.Geoms import Circle, Domain
25
26
27 def Plot_Result(simu: Elastic, result: str, img=None, title="", plotMesh=True):
28 ax = Display.Init_Axes()
29 if img is not None:
30 ax.imshow(img, cmap="gray")
31 Display.Plot_Result(simu, result, title=title, plotMesh=plotMesh, ax=ax)
32
33
34 if __name__ == "__main__":
35
36 # ----------------------------------------------
37 # Config
38 # ----------------------------------------------
39
40 useRegularization = True
41
42 imagesDir = Folder.Join(Folder.Dir(), "_images1")
43
44 # ----------------------------------------------
45 # Load images
46 # ----------------------------------------------
47
48 images = [
49 Folder.Join(imagesDir, image)
50 for image in sorted(Folder.os.listdir(imagesDir))
51 if image.endswith(".png")
52 ]
53
54 imgRef = np.asarray(Image.open(images[0]), dtype=int)
55
56 ax = Display.Init_Axes()
57 ax.imshow(imgRef, cmap="gray")
58
59 # ----------------------------------------------
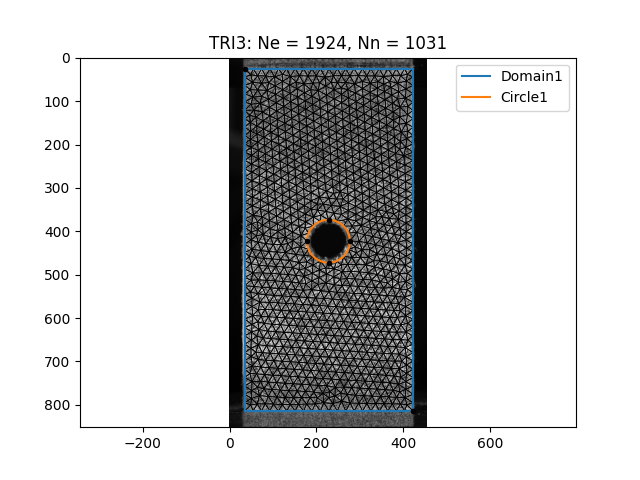
60 # Create Mesh
61 # ----------------------------------------------
62
63 imgScale = 0.11479591836734694 # mm/px
64
65 x0, y0 = 35, 25
66 x1, y1 = 423, 814
67 meshSize = (x1 - x0) / 20
68 contour = Domain((x0, y0), (x1, y1), meshSize)
69 contour.Plot(ax)
70
71 xC, yC, radius = DIC.Get_Circle(imgRef, 30.0, [(150, 350), (350, 500)])
72 circle = Circle((xC, yC), 2 * radius, meshSize)
73 circle.Plot(ax)
74
75 mesh = contour.Mesh_2D([circle])
76
77 Display.Plot_Mesh(mesh, alpha=0, edgecolor="black", ax=ax)
78 ax.legend()
79
80 # ----------------------------------------------
81 # Conduct DIC analyses
82 # ----------------------------------------------
83
84 lr = int(np.sqrt(0.25) * 8 * meshSize) if useRegularization else 0
85 dic = DIC(mesh, imgRef, lr, verbosity=True)
86
87 # Generate an elastic simulation to streamline the visualization of results.
88 simu = Elastic(mesh, Models.Elastic.Isotropic(2, E=1, v=0.3))
89
90 for image in images[1:]:
91
92 imgStr = image.removeprefix(imagesDir)
93 print(f"\n {imgStr}")
94 img = np.asarray(Image.open(image), dtype=int)
95
96 u = dic.Solve(img)
97
98 simu._Set_solutions(simu.problemType, u * imgScale)
99 simu.Save_Iter()
100
101 if image == images[-1]:
102 Plot_Result(simu, "ux", img, f"{imgStr} ux")
103 Plot_Result(simu, "uy", img, f"{imgStr} uy")
104 Plot_Result(simu, "Exx", img, f"{imgStr} Exx")
105
106 plt.show()
Total running time of the script: (0 minutes 8.671 seconds)