Note
Go to the end to download the full example code.
k_means#
KMeans using scikit-learn according to https://www.youtube.com/watch?v=i-gxm_ofjBo.
13 import matplotlib.pyplot as plt
14 import numpy as np
15
16 from EasyFEA import Display
17
18 from sklearn.cluster import KMeans
19 from sklearn.datasets import make_blobs
20 from sklearn.metrics import silhouette_score
21
22 if __name__ == "__main__":
23 # https://www.youtube.com/watch?v=i-gxm_ofjBo
24
25 Display.Clear()
26
27 N = 1000
28
29 K = 5
30
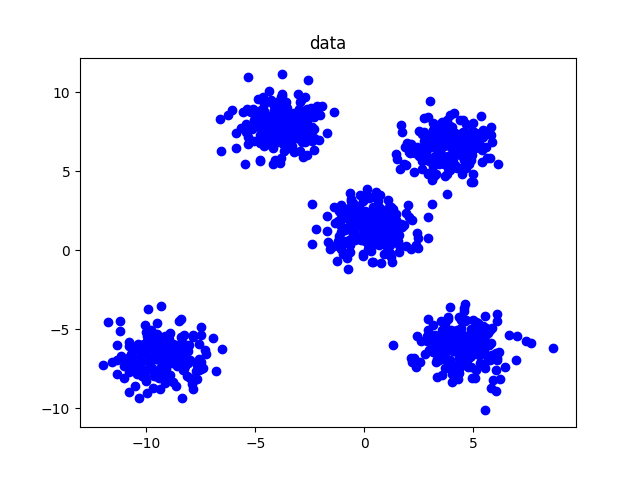
31 data = make_blobs(N, 2, centers=5, cluster_std=1, random_state=101)[0]
32
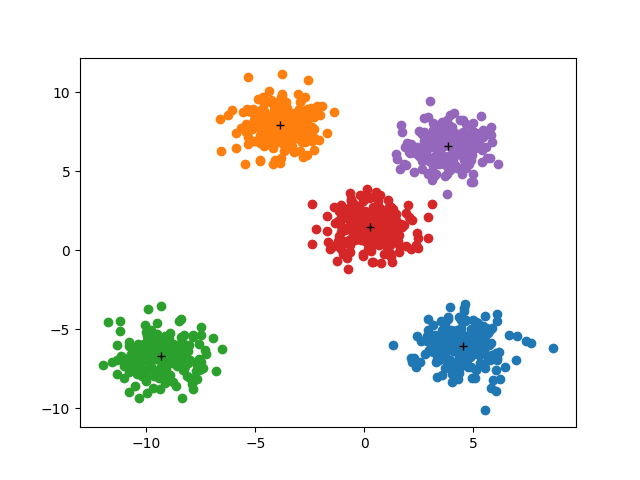
33 kmeans = KMeans(K, n_init="auto")
34
35 clusters = kmeans.fit_predict(data)
36
37 ax = Display.Init_Axes()
38 ax.plot(*data.T, "bo")
39 ax.set_title("data")
40
41 ax_c = Display.Init_Axes()
42 for k in range(K):
43 idx = np.where(clusters == k)
44 ax_c.plot(*data[idx].T, "o")
45 ax_c.plot(*np.mean(data[idx], 0), ls="", marker="+", c="black", zorder=10)
46
47 sil_score = []
48 sse = []
49
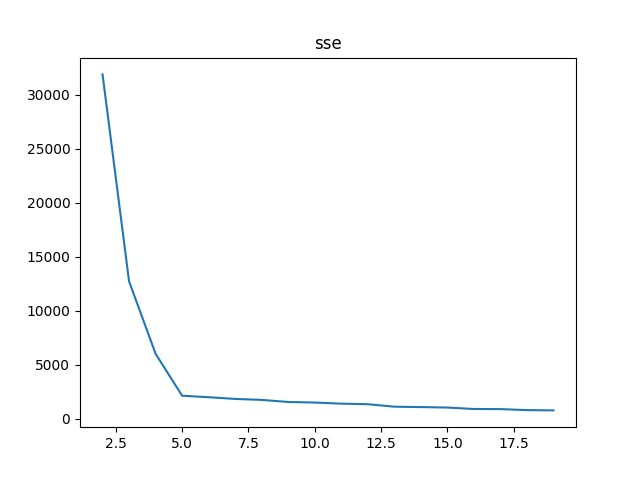
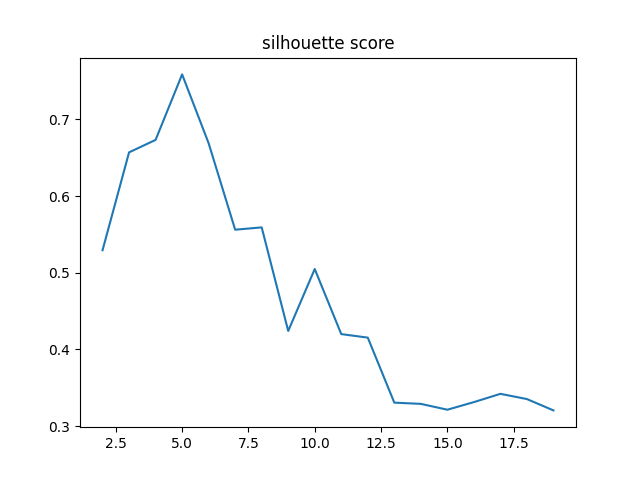
50 array_k = np.arange(2, 20)
51
52 for k in array_k:
53 kmeans = KMeans(k, n_init="auto")
54
55 clusters = kmeans.fit_predict(data)
56
57 sse.append(kmeans.inertia_)
58 sil_score.append(silhouette_score(data, clusters))
59
60 a_sse = Display.Init_Axes()
61 a_sse.plot(array_k, sse)
62 a_sse.set_title("sse")
63
64 a_sil = Display.Init_Axes()
65 a_sil.plot(array_k, sil_score)
66 a_sil.set_title("silhouette score")
67
68 plt.show()
Total running time of the script: (0 minutes 0.810 seconds)