geoms#
The EasyFEA/geoms/ module in EasyFEA provides essential tools for creating and managing _Geom objects. These geometric objects are used to construct Mesh using the Mesher.
With this module, you can construct:
|
Point class. |
|
Points class. |
|
Domain (2d or 3d domain) class. |
|
Line class. |
|
Circle class. |
|
CircleArc class. |
|
Contour class. |
Once the geometric objects are created, you can manipulate them using copy(), Translate(), Rotate(), or Symmetry() (see the example for details).
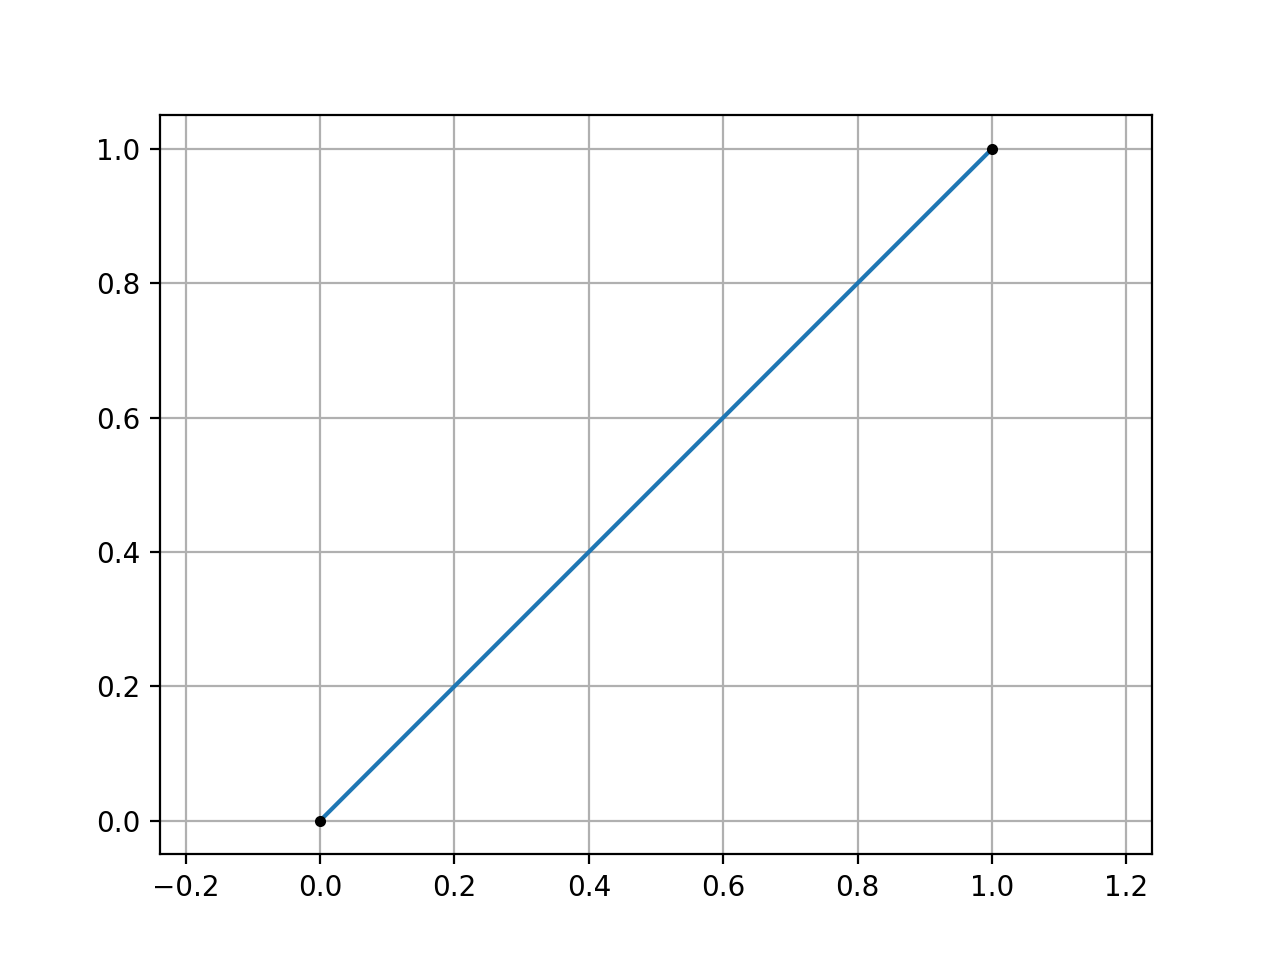
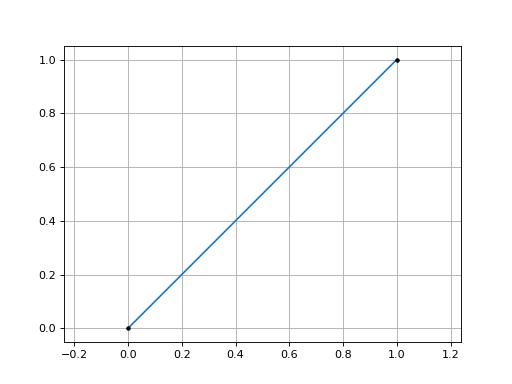
Creating a Line#
from EasyFEA.Geoms import Line

line = Line((0,0), (1,1))
line.Plot()
(Source code, png, hires.png, pdf)
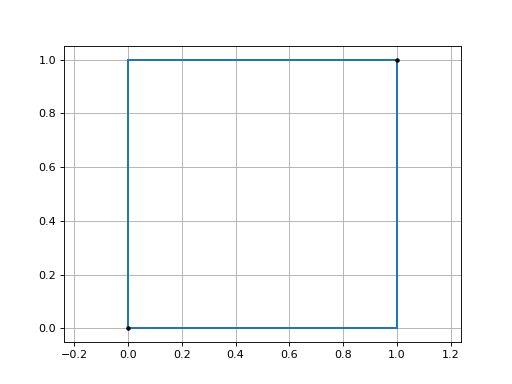
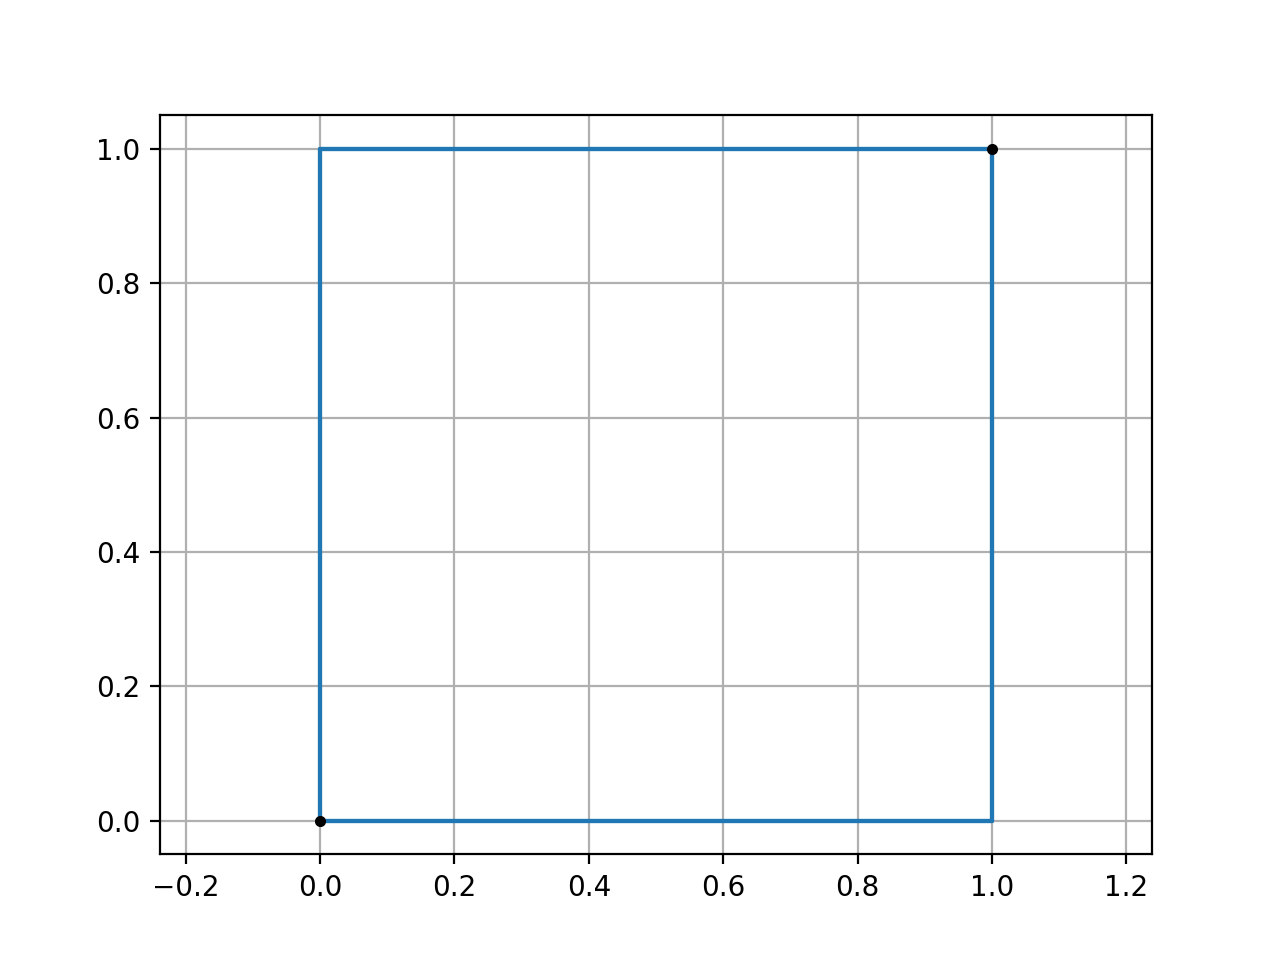
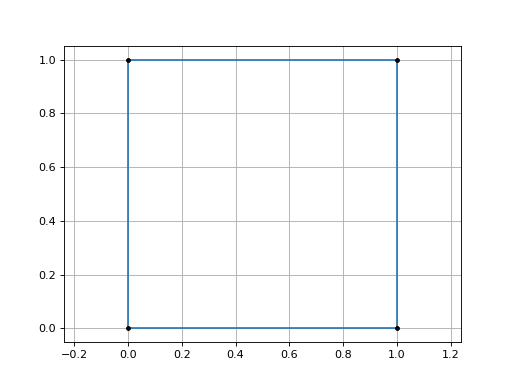
Creating a Domain/Box#
2D Domain#
from EasyFEA.Geoms import Domain

domain = Domain((0, 0), (1, 1))
domain.Plot()
(Source code, png, hires.png, pdf)

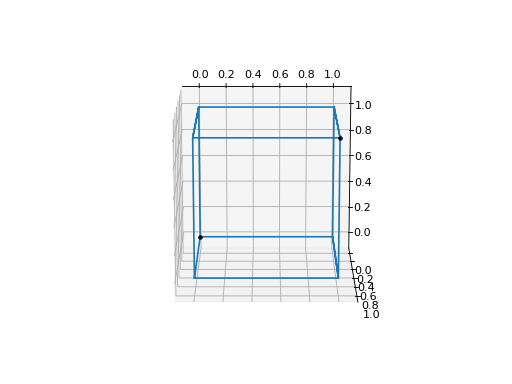
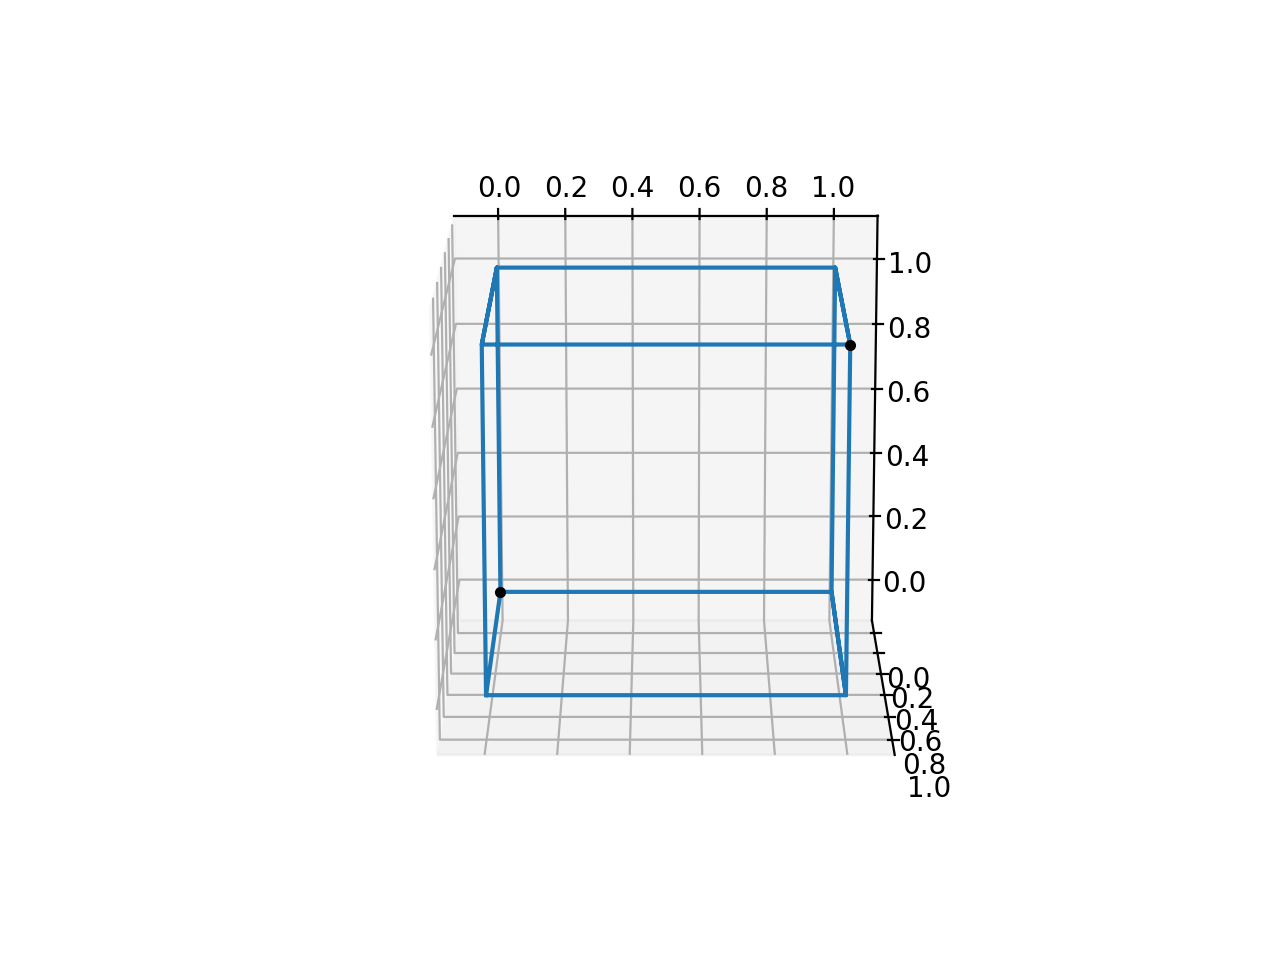
3D Domain#
from EasyFEA.Geoms import Domain

domain = Domain((0, 0, 0), (1, 1, 1))
domain.Plot()
(Source code, png, hires.png, pdf)

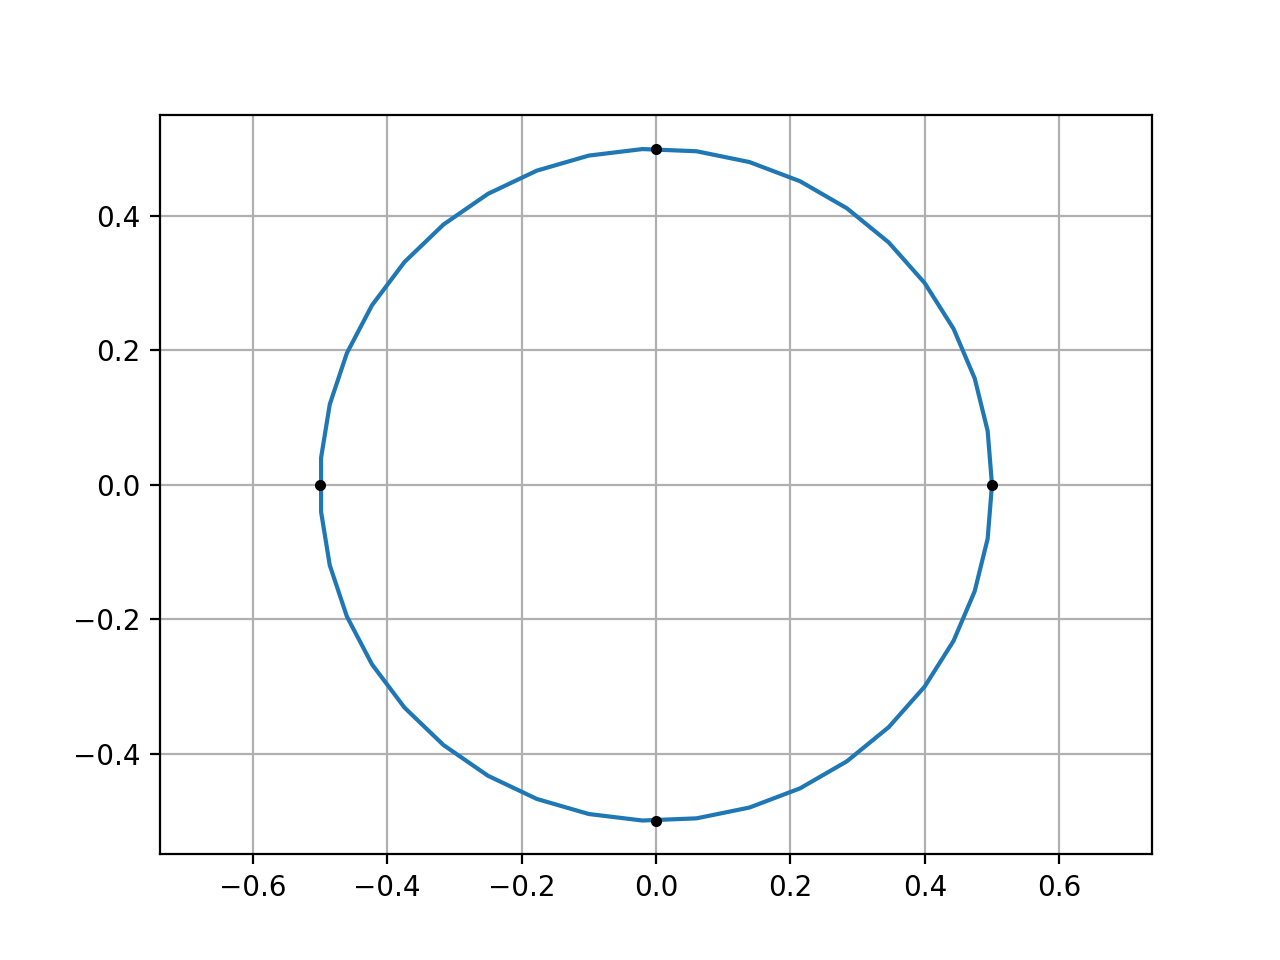
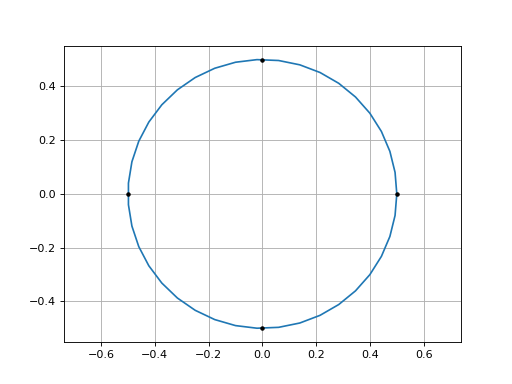
Creating a Circle#
from EasyFEA.Geoms import Circle

circle = Circle((0, 0), 1.0)
circle.Plot()
(Source code, png, hires.png, pdf)
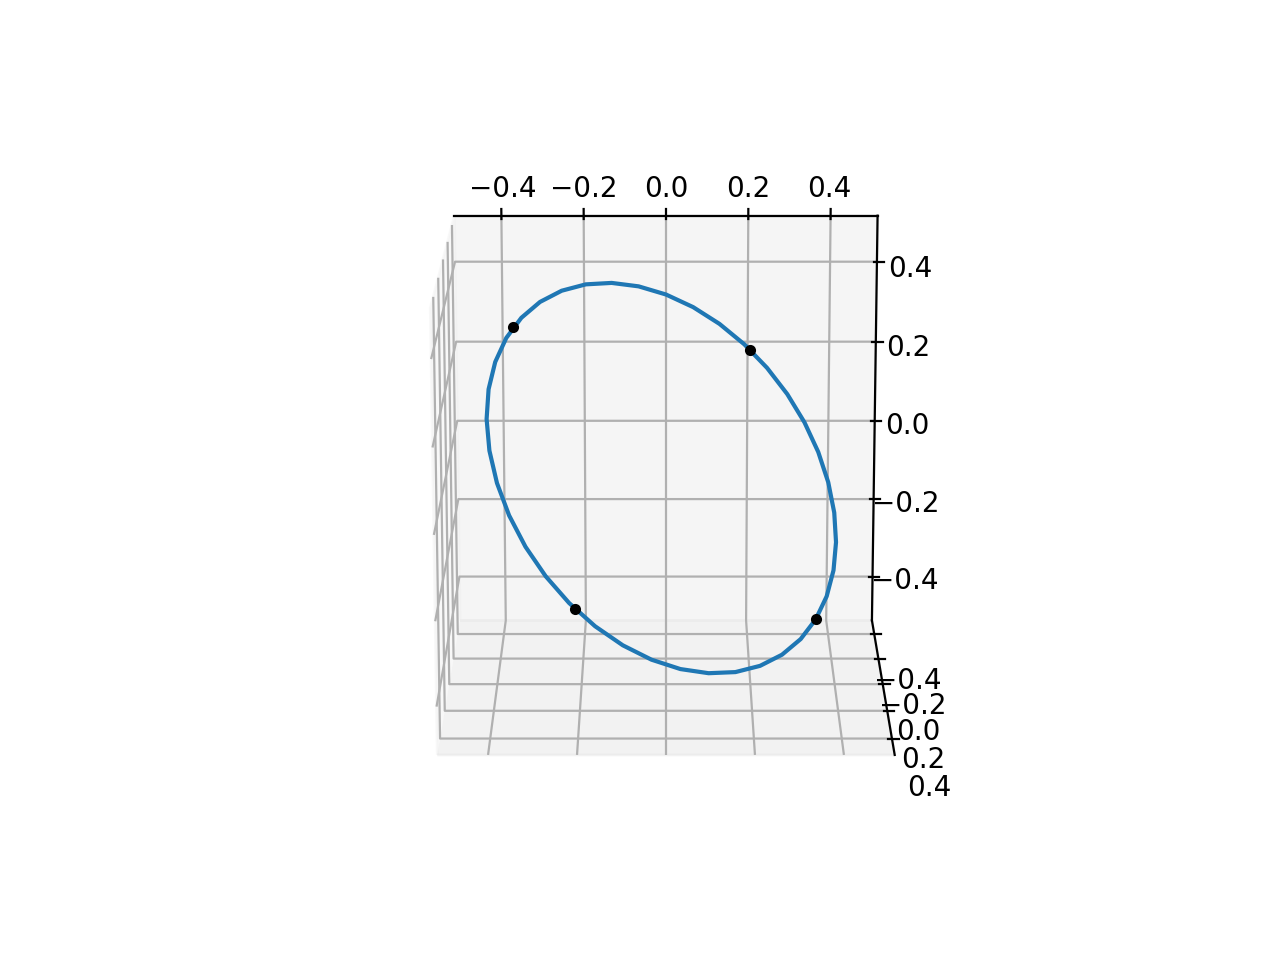
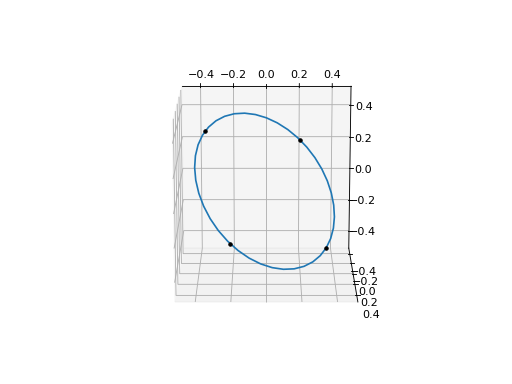
Using an axis normal to the circle#
from EasyFEA.Geoms import Circle

circle = Circle((0, 0), 1.0, n=(0.5, 0.5, 0.5))
circle.Plot()
(Source code, png, hires.png, pdf)
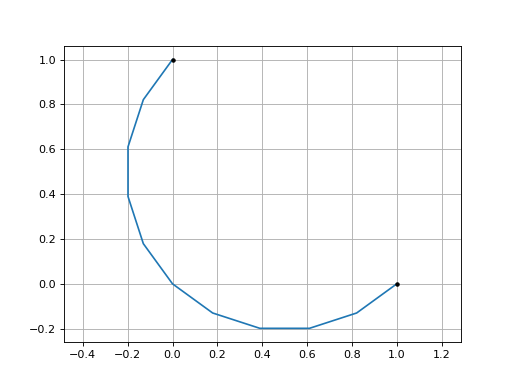
Creating a CircleArc#
From 2 Point and a Center#
from EasyFEA.Geoms import CircleArc

circleArc = CircleArc((1, 0), (0, 1), center=(0, 0))
circleArc.Plot()
(Source code, png, hires.png, pdf)

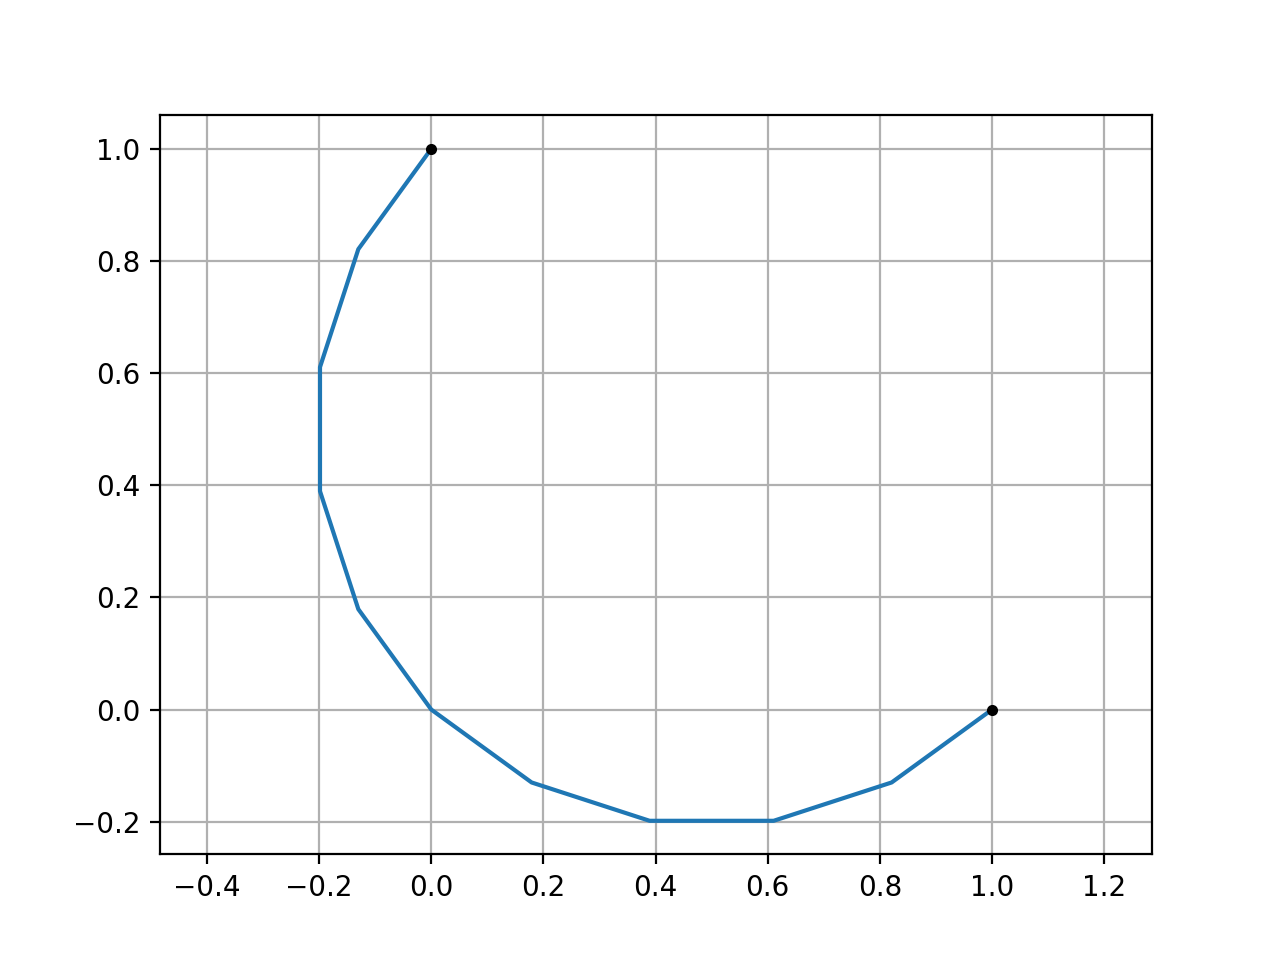
From 2 Point and a Radius#
from EasyFEA.Geoms import CircleArc

circleArc = CircleArc((1, 0), (0, 1), R=0.5)
circleArc.Plot()
(Source code, png, hires.png, pdf)

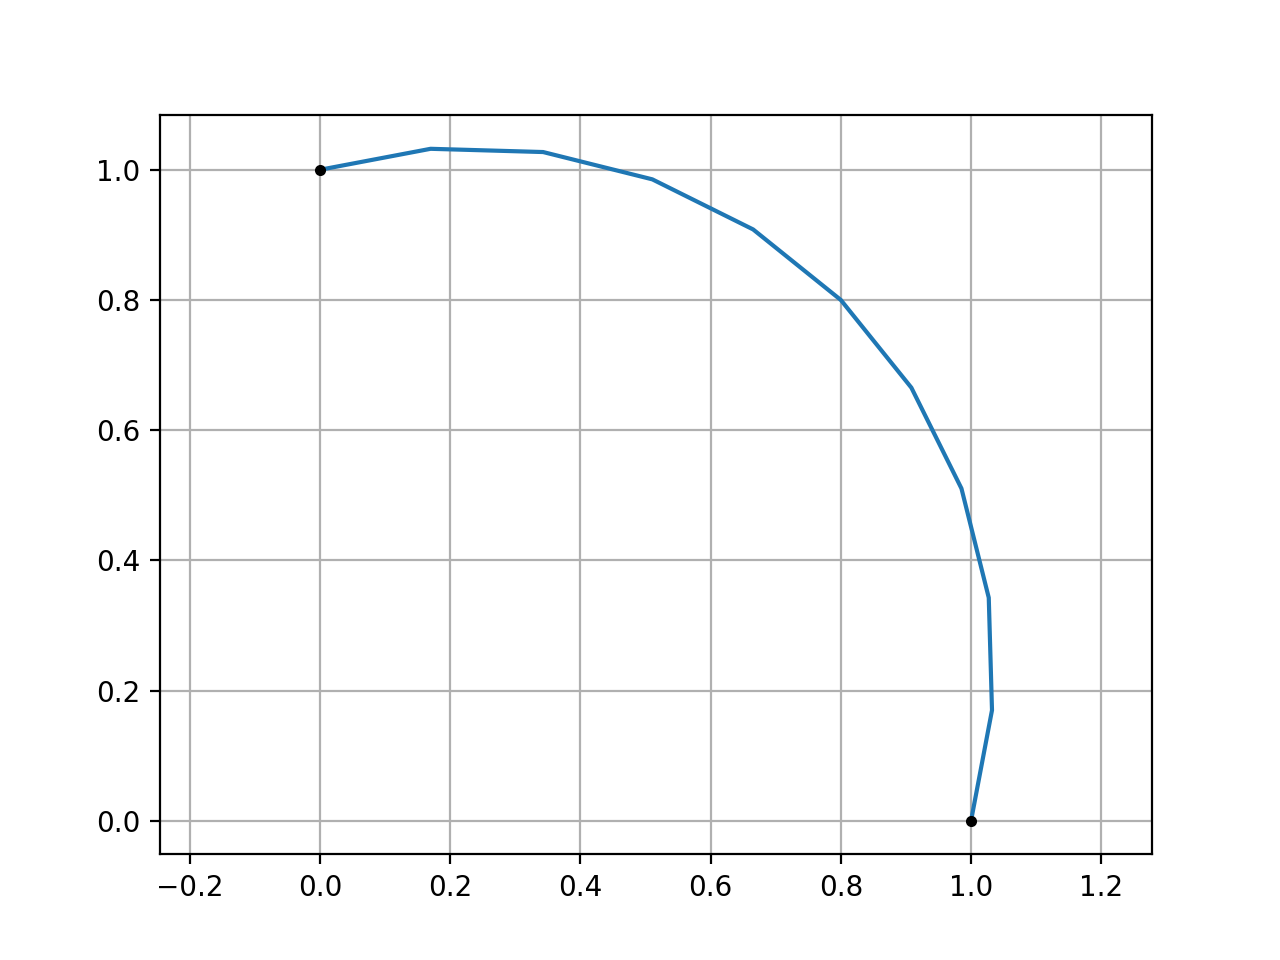
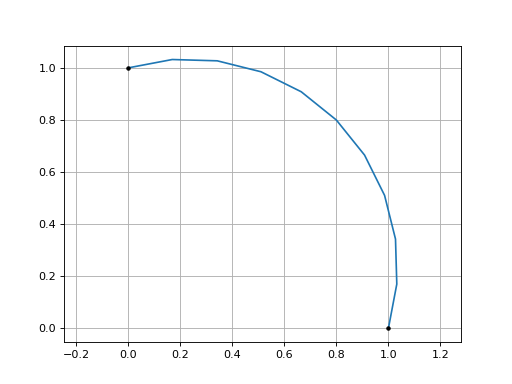
From 2 Point and a Point#
from EasyFEA.Geoms import CircleArc

circleArc = CircleArc((1, 0), (0, 1), P=(0.8, 0.8))
circleArc.Plot()
(Source code, png, hires.png, pdf)
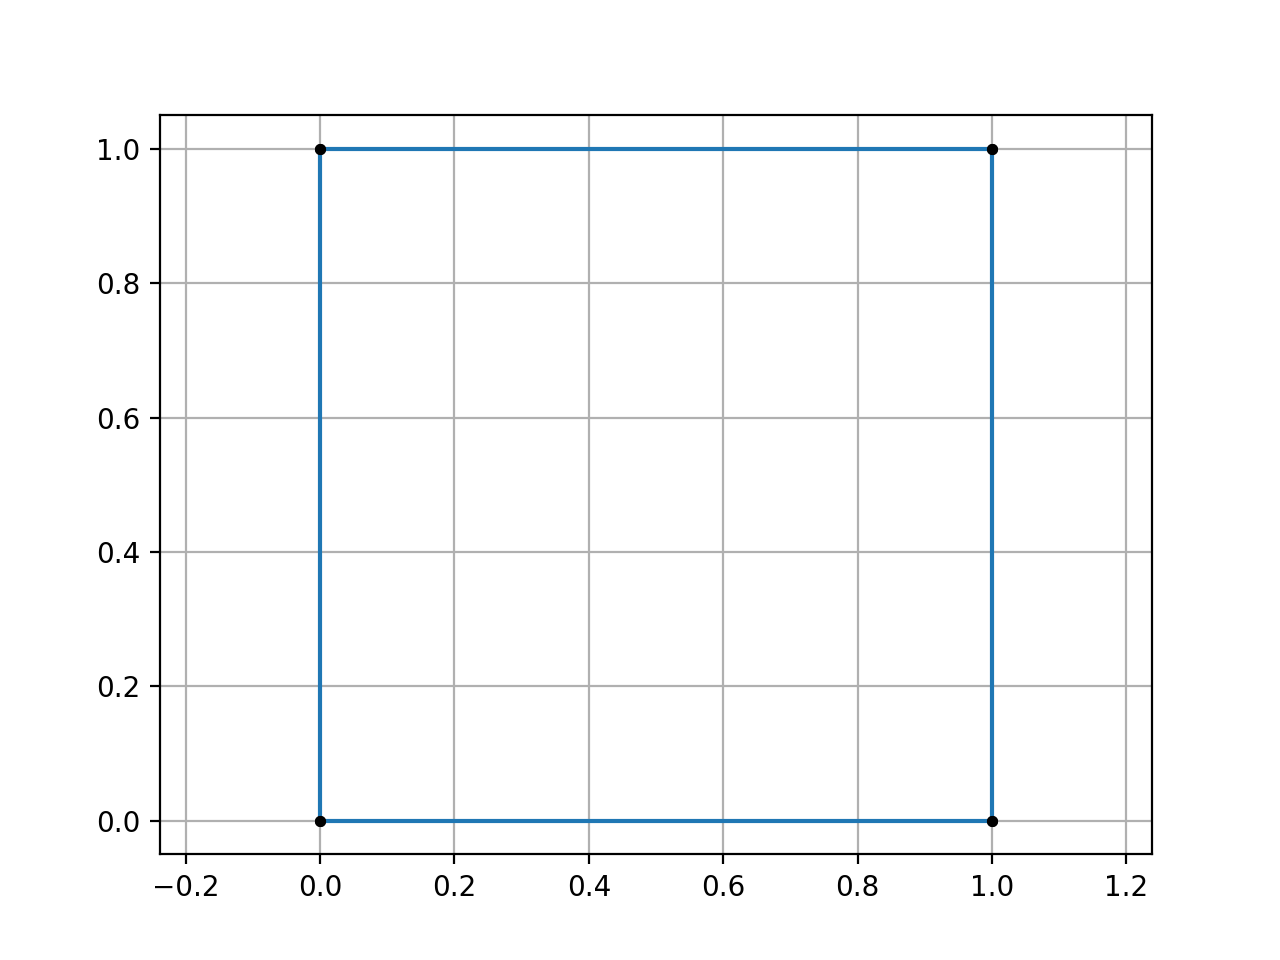
Creating a Contour from Points#
from EasyFEA.Geoms import Points

contour = Points([(0, 0), (1,0), (1,1), (0,1)]).Get_Contour()
contour.Plot()
(Source code, png, hires.png, pdf)

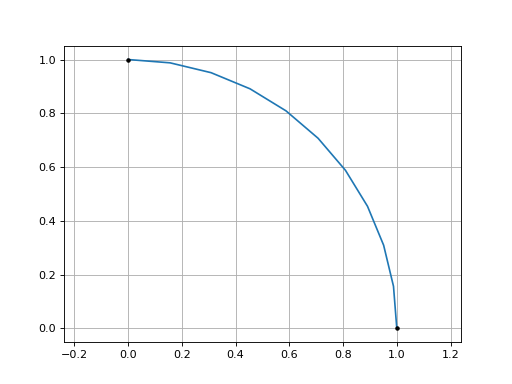
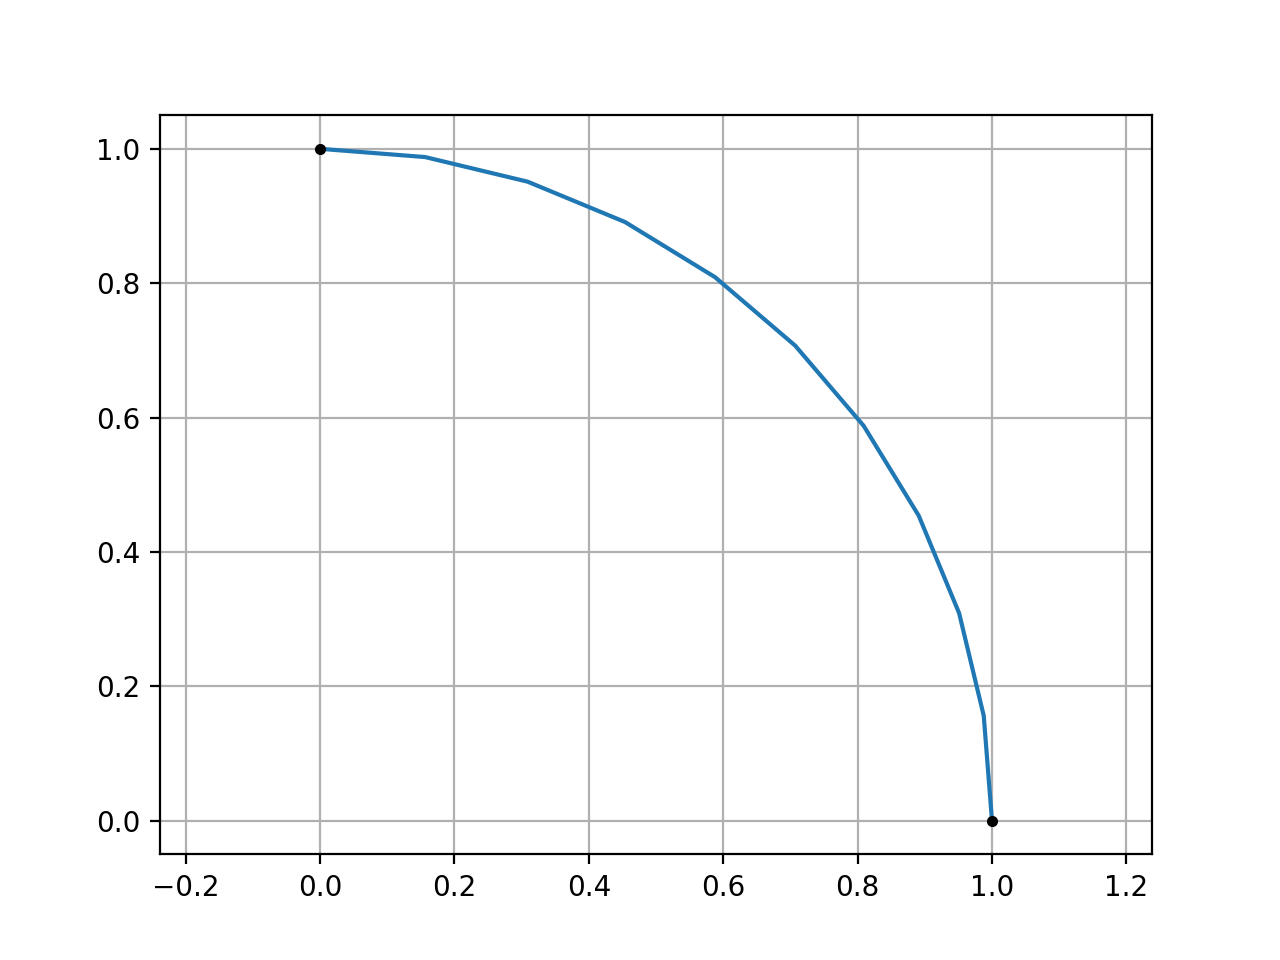
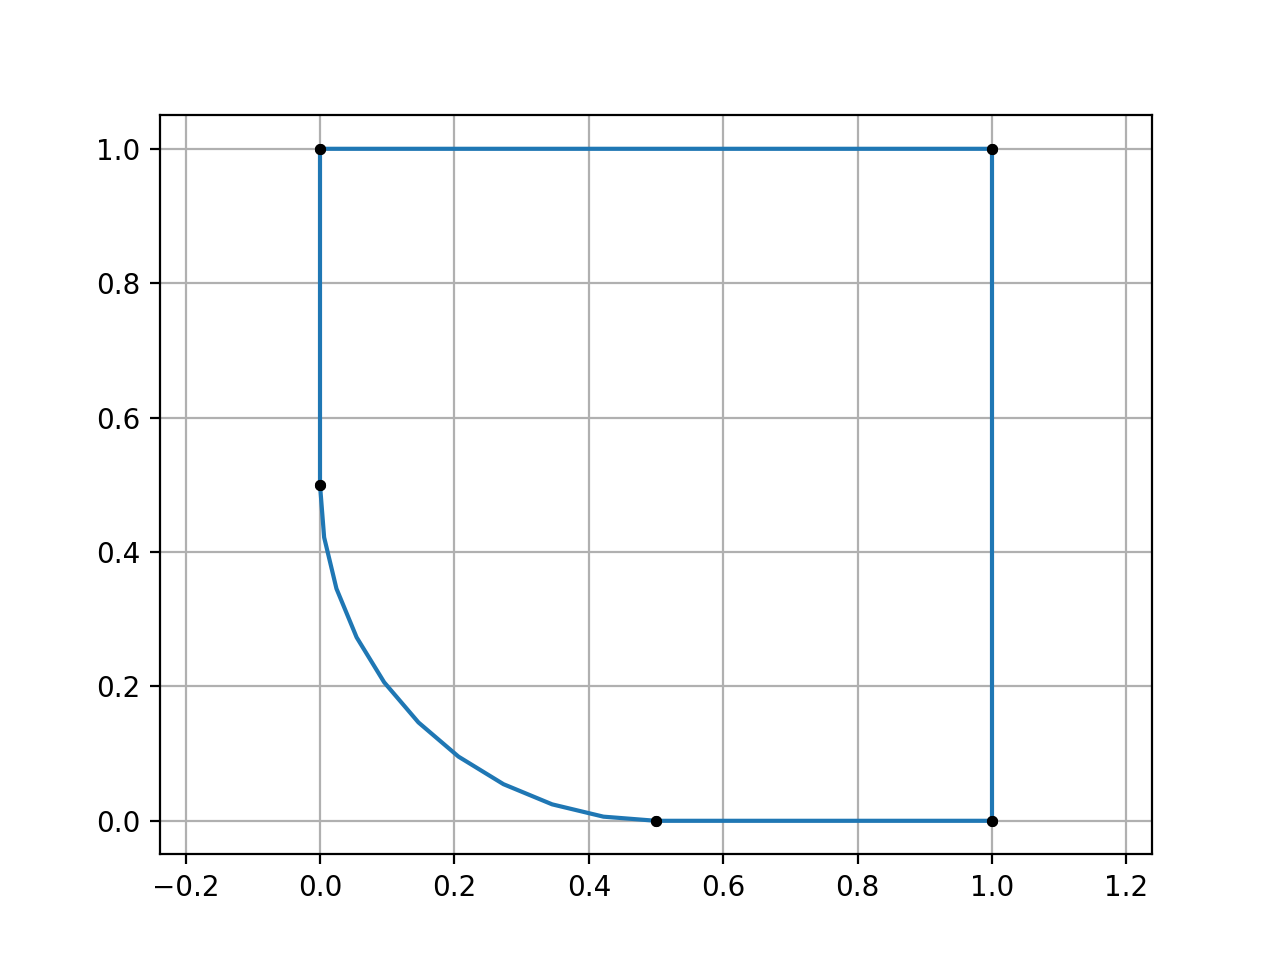
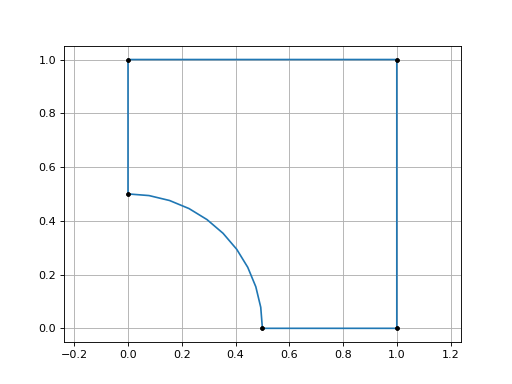
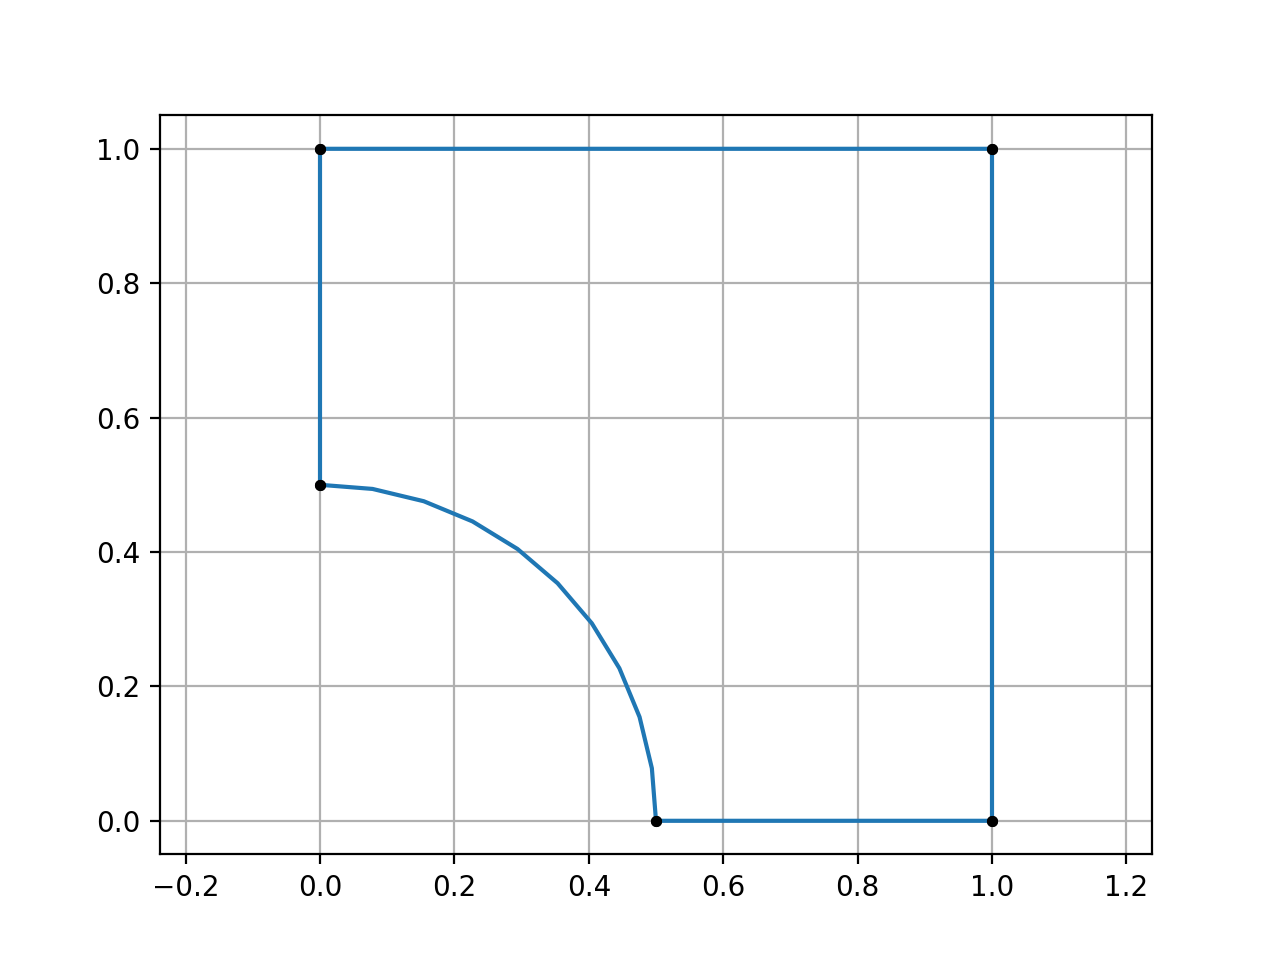
Add a fillet#
from EasyFEA.Geoms import Point, Points

contour = Points([Point(0, 0, r=0.5), (1,0), (1,1), (0,1)]).Get_Contour()
contour.Plot()
(Source code, png, hires.png, pdf)
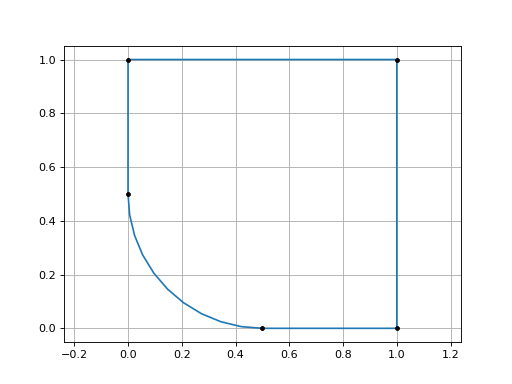
from EasyFEA.Geoms import Point, Points

contour = Points([Point(0, 0, r=-0.5), (1,0), (1,1), (0,1)]).Get_Contour()
contour.Plot()
(Source code, png, hires.png, pdf)

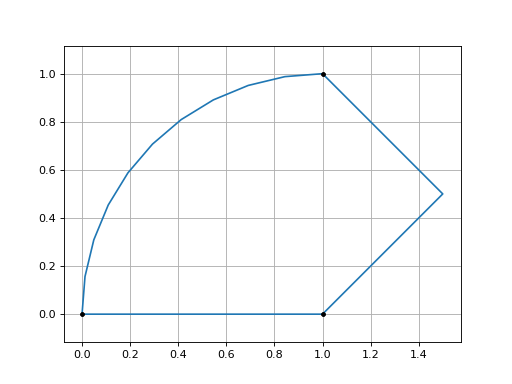
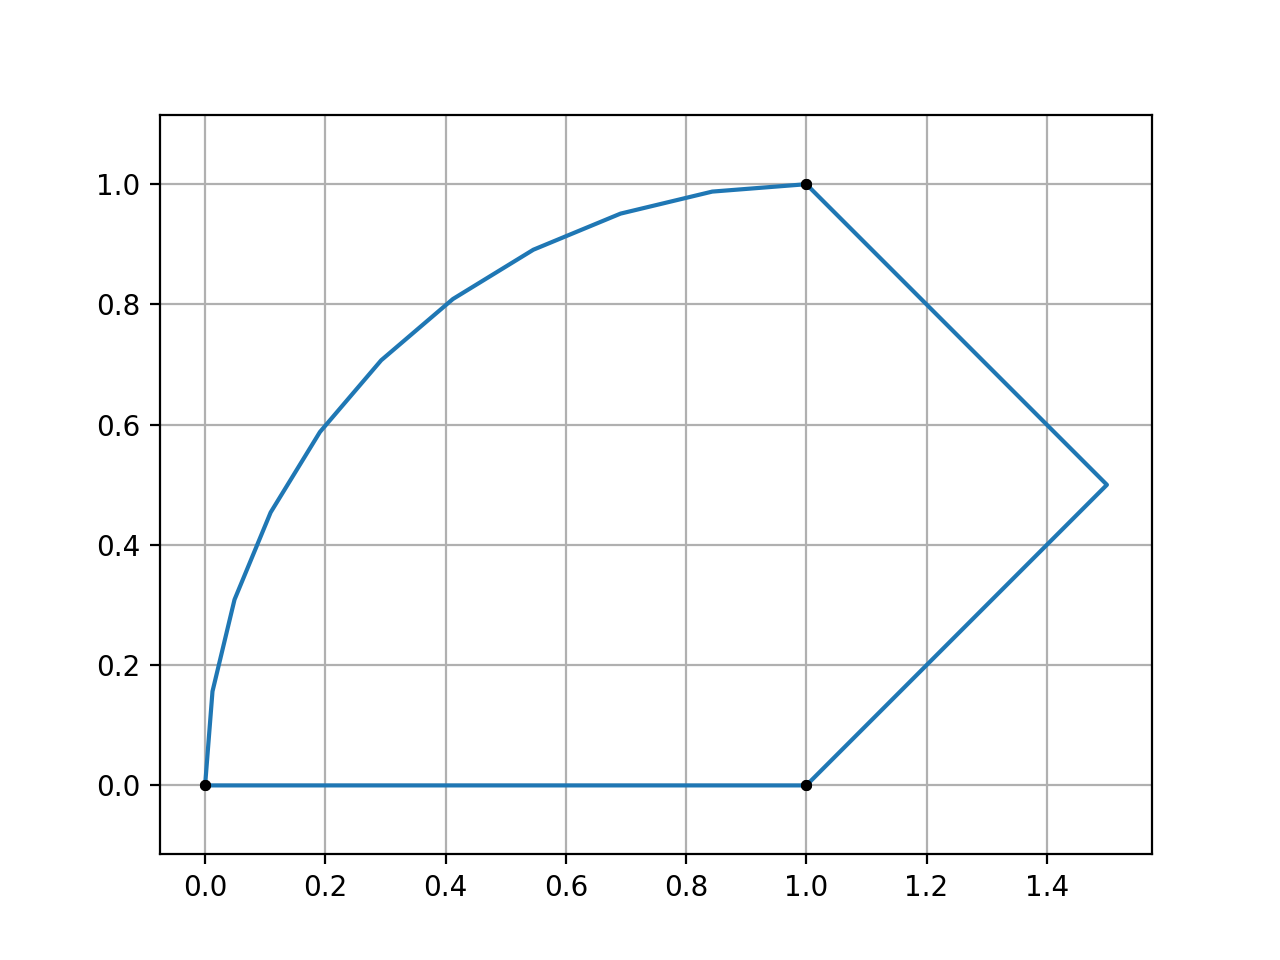
Creating a Contour with Line, CircleArc and Points#
from EasyFEA.Geoms import Line, CircleArc, Points, Contour

line = Line((0, 0), (1, 0))
points = Points([(1,0), (1.5, 0.5), (1, 1)])
circleArc = CircleArc((1,1), (0,0), center=(1,0))
contour = Contour([line, points, circleArc])
contour.Plot()
(Source code, png, hires.png, pdf)

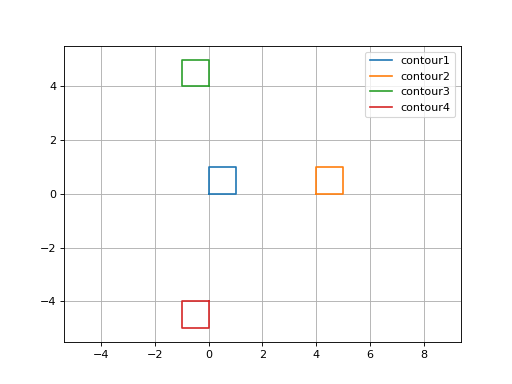
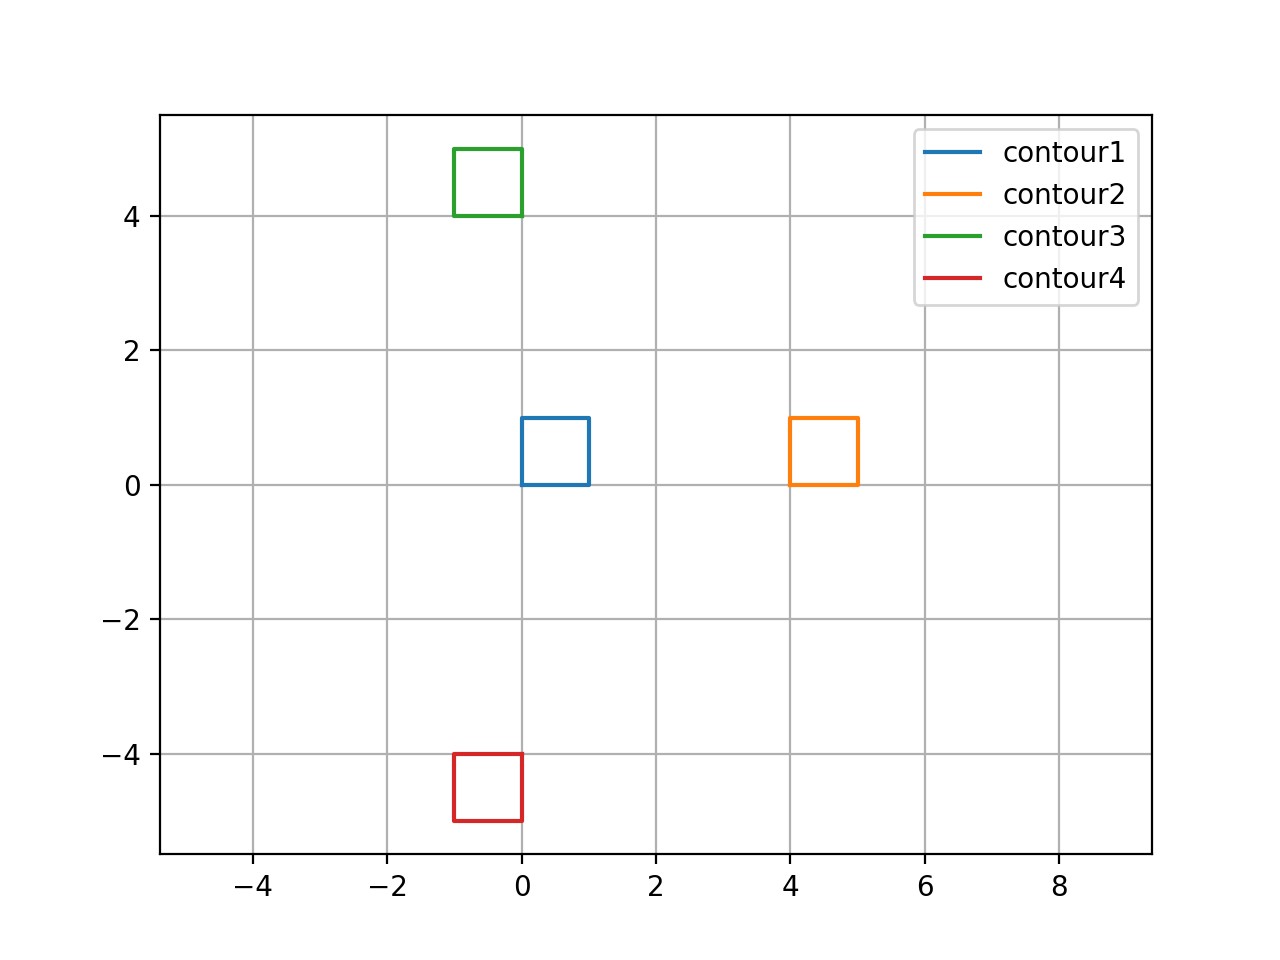
Manipulate a _Geom object using the copy(), Translate(), Rotate(), and Symmetry() functions#
from EasyFEA.Geoms import Points

contour1 = Points([(0,0), (1,0), (1,1), (0,1)]).Get_Contour()
contour2 = contour1.copy(); contour2.Translate(dx=4)
contour3 = contour2.copy(); contour3.Rotate(90, (0,0), (0,0,1))
contour4 = contour3.copy(); contour4.Symmetry((0,0), (0,1))

ax = contour1.Plot_Geoms([contour1, contour2, contour3, contour4], plotPoints=False)
ax.legend(["contour1", "contour2", "contour3", "contour4"])
(Source code, png, hires.png, pdf)

Detailed geoms API#
Module containing the geometric classes used to build meshes.
Module containing the geometric functions used to build meshes.
- EasyFEA.geoms.Angle_Between(a, b)[source]#
Computes the angle between vectors a and b (rad). https://math.stackexchange.com/questions/878785/how-to-find-an-angle-in-range0-360-between-2-vectors
- Return type:
float
- EasyFEA.geoms.AsCoords(value)[source]#
Returns value as a 3D vector
- Return type:
ndarray[tuple[Any,...],dtype[floating]]
- class EasyFEA.geoms.Circle(center, diam, meshSize=0.0, isHollow=True, isOpen=False, n=(0, 0, 1))[source]#
Bases:
_GeomCircle class.
- Get_coord_for_plot()[source]#
Returns lines and points coordinates for plotting.
- Returns:
Lines and points coordinates as NumPy arrays.
- Return type:
tuple of ndarray
- __NCircle = 39#
- _abc_impl = <_abc._abc_data object>#
- property diam: float#
circle’s diameter
- property length: float#
circle perimeter
- property n: ndarray[tuple[Any, ...], dtype[Any]] | Collection[int | float]#
axis normal to the circle
- class EasyFEA.geoms.CircleArc(pt1, pt2, center=None, R=None, P=None, meshSize=0.0, n=(0, 0, 1), isOpen=False, coef=1)[source]#
Bases:
_GeomCircleArc class.
- Get_coord_for_plot()[source]#
Returns lines and points coordinates for plotting.
- Returns:
Lines and points coordinates as NumPy arrays.
- Return type:
tuple of ndarray
- __NCircleArc = 242#
- _abc_impl = <_abc._abc_data object>#
- property angle#
circular arc angle [rad]
- center#
Point at the center of the arc.
- property length: float#
circular arc length
- property n: ndarray[tuple[Any, ...], dtype[Any]] | Collection[int | float]#
axis normal to the circle arc
- pt1#
Starting point of the arc.
- pt2#
Ending point of the arc.
- pt3#
Midpoint of the circular arc.
- property r#
circular arc radius
- EasyFEA.geoms.Circle_Coords(coord, R, n)[source]#
Returns center from coordinates a radius and and a vector normal to the circle.
return center
- Return type:
ndarray[tuple[Any,...],dtype[floating]]
- EasyFEA.geoms.Circle_Triangle(p1, p2, p3)[source]#
Returns triangle’s center for the circumcicular arc formed by 3 points.
returns center
- Return type:
ndarray[tuple[Any,...],dtype[floating]]
- class EasyFEA.geoms.Contour(geoms, isHollow=True, isOpen=False)[source]#
Bases:
_GeomContour class.
- Get_coord_for_plot()[source]#
Returns lines and points coordinates for plotting.
- Returns:
Lines and points coordinates as NumPy arrays.
- Return type:
tuple of ndarray
- __NContour = 111#
- _abc_impl = <_abc._abc_data object>#
- property length: float#
- class EasyFEA.geoms.Domain(pt1, pt2, meshSize=0.0, isHollow=True)[source]#
Bases:
_GeomDomain (2d or 3d domain) class.
- Get_coord_for_plot()[source]#
Returns lines and points coordinates for plotting.
- Returns:
Lines and points coordinates as NumPy arrays.
- Return type:
tuple of ndarray
- __NDomain = 266#
- _abc_impl = <_abc._abc_data object>#
- EasyFEA.geoms.Fillet(P0, P1, P2, r)[source]#
Computes fillet in a corner P0.
returns A, B, C
- Parameters:
P0 (_types.AnyArray) – coordinates of point with radius
P1 (_types.AnyArray) – coordinates before P0 coordinates
P2 (_types.AnyArray) – coordinates after P0 coordinates
r (float) – radius (or fillet) at point P0
- Returns:
coordinates calculated to construct the radius
- Return type:
tuple[_types.FloatArray, _types.FloatArray, _types.FloatArray]
- EasyFEA.geoms.Jacobian_Matrix(i, k)[source]#
Computes the Jacobian matrix to transform local coordinates (i,j,k) to global (x,y,z) coordinates.
p(x,y,z) = J • p(i,j,k) and p(i,j,k) = inv(J) • p(x,y,z)
ix jx kx
iy jy ky
iz jz kz
- Parameters:
i (_types.Coords) – i vector
k (_types.Coords) – k vector
- Return type:
ndarray[tuple[Any,...],dtype[floating]]
- class EasyFEA.geoms.Line(pt1, pt2, meshSize=0.0, isOpen=False)[source]#
Bases:
_GeomLine class.
- Get_coord_for_plot()[source]#
Returns lines and points coordinates for plotting.
- Returns:
Lines and points coordinates as NumPy arrays.
- Return type:
tuple of ndarray
- __NLine = 845#
- _abc_impl = <_abc._abc_data object>#
- static get_unitVector(pt1, pt2)[source]#
Creates the unit vector between two points.
- Return type:
ndarray[tuple[Any,...],dtype[floating]]
- property length: float#
distance between the two points of the line
- property unitVector: ndarray[tuple[Any, ...], dtype[floating]]#
The unit vector for the two points on the line (p2-p1)
- EasyFEA.geoms.Normalize(array)[source]#
Must be a vector or matrix.
- Return type:
ndarray[tuple[Any,...],dtype[floating]]
- class EasyFEA.geoms.Point(x=0.0, y=0.0, z=0.0, isOpen=False, r=0.0)[source]#
Bases:
objectPoint class.
- Rotate(theta, center=(0, 0, 0), direction=(0, 0, 1))[source]#
Rotates the point with around an axis.
- Parameters:
theta (float) – rotation angle [deg]
center (_types.Coords, optional) – rotation center, by default (0,0,0)
direction (_types.Coords, optional) – rotation direction, by default (0,0,1)
- Return type:
None
- Symmetry(point=(0, 0, 0), n=(1, 0, 0))[source]#
Symmetrizes the point coordinates with a plane.
- Parameters:
point (_types.Coords, optional) – a point belonging to the plane, by default (0,0,0)
n (_types.Coords, optional) – normal to the plane, by default (1,0,0)
- Return type:
None
- property coord: ndarray[tuple[Any, ...], dtype[floating]]#
[x,y,z] coordinates
-
isOpen:
bool# point is open
-
r:
float# radius used for fillet
- property x: float#
x coordinate
- property y: float#
y coordinate
- property z: float#
z coordinate
- class EasyFEA.geoms.Points(points, meshSize=0.0, isHollow=True, isOpen=False)[source]#
Bases:
_GeomPoints class.
- Get_Contour()[source]#
Creates a contour from the points.
Creates a fillet if a point has a radius which is not 0.
- Get_coord_for_plot()[source]#
Returns lines and points coordinates for plotting.
- Returns:
Lines and points coordinates as NumPy arrays.
- Return type:
tuple of ndarray
- __NPoints = 59#
- _abc_impl = <_abc._abc_data object>#
- property length: float#
- pt1#
First point
- pt2#
Last point
- EasyFEA.geoms.Points_Intersect_Circles(circle1, circle2)[source]#
Computes the coordinates at the intersection of the two circles (i,3).
This only works if they’re on the same plane.
- EasyFEA.geoms.Rotate(coord, theta, center=(0, 0, 0), direction=(0, 0, 1))[source]#
Rotates the coordinates arround a specified center and axis.
- Parameters:
coord (_types.AnyArray) – coordinates to rotate (n,3)
theta (float) – rotation angle [deg]
center (_types.Iterable, optional) – rotation center, by default (0,0,0)
direction (_types.Iterable, optional) – rotation direction, by default (0,0,1)
- Returns:
rotated coordinates
- Return type:
_types.FloatArray
- EasyFEA.geoms.Symmetry(coord, point=(0, 0, 0), n=(1, 0, 0))[source]#
Symmetrizes coordinates with a plane.
- Parameters:
coord (_types.AnyArray) – coordinates that we want to symmetrise
point (tuple, optional) – a point belonging to the plane, by default (0,0,0)
n (tuple, optional) – normal to the plane, by default (1,0,0)
- Returns:
the new coordinates
- Return type:
_types.FloatArray
- EasyFEA.geoms.Translate(coord, dx=0.0, dy=0.0, dz=0.0)[source]#
Translates the coordinates.
- Return type:
ndarray[tuple[Any,...],dtype[floating]]
- class EasyFEA.geoms._Geom(points, meshSize, name, isHollow, isOpen)[source]#
Bases:
ABCGeometric class.
- abstractmethod Get_coord_for_plot()[source]#
Returns lines and points coordinates for plotting.
- Returns:
Lines and points coordinates as NumPy arrays.
- Return type:
tuple of ndarray
- Mesh_2D(inclusions=[], elemType=ElemType.TRI3, cracks=[], refineGeoms=[], isOrganised=False, additionalSurfaces=[], additionalLines=[], additionalPoints=[], folder='')[source]#
Creates a 2D mesh from a contour and inclusions that must form a closed plane surface.
- Parameters:
inclusions (list[Domain, Circle, Points, Contour], optional) – list of hollow and filled geom objects inside the domain
elemType (ElemType, optional) – element type, by default “TRI3” [“TRI3”, “TRI6”, “TRI10”, “TRI15”, “QUAD4”, “QUAD8”, “QUAD9”]
cracks (list[Line | Points | Contour | CircleArc]) – list of geom object used to create open or closed cracks
refineGeoms (list[Domain|Circle|str], optional) – list of geom object for mesh refinement, by default []
isOrganised (bool, optional) – mesh is organized, by default False
additionalSurfaces (list[Domain, Circle, Points, Contour]) – additional surfaces that will be added to or removed from the surfaces created by the contour and the inclusions. (e.g Domain, Circle, Contour, Points). Tip: if the mesh is not well generated, you can also give the inclusions.
additionalLines (list[Union[Line,CircleArc]]) – additional lines that will be added to the surfaces created by the contour and the inclusions. (e.g Domain, Circle, Contour, Points). WARNING: lines must be within the domain.
additionalPoints (list[Point]) – additional points that will be added to the surfaces created by the contour and the inclusions. WARNING: points must be within the domain.
folder (str, optional) – default mesh.msh folder, by default “” does not save the mesh
- Returns:
Created mesh
- Return type:
- Mesh_Extrude(inclusions=[], extrude=(0, 0, 1), layers=[], elemType=ElemType.TETRA4, cracks=[], refineGeoms=[], isOrganised=False, additionalSurfaces=[], additionalLines=[], additionalPoints=[], folder='')[source]#
Creates a 3D mesh by extruding a surface constructed from a contour and inclusions.
- Parameters:
inclusions (list[Domain, Circle, Points, Contour], optional) – list of hollow and filled geom objects inside the domain
extrude (Coords, optional) – extrusion vector, by default [0,0,1]
layers (list[int], optional) – layers in the extrusion, by default []
elemType (ElemType, optional) – element type, by default “TETRA4” [“TETRA4”, “TETRA10”, “HEXA8”, “HEXA20”, “HEXA27”, “PRISM6”, “PRISM15”, “PRISM18”]
cracks (list[Line | Points | Contour | CircleArc]) – list of geom object used to create open or closed cracks
refineGeoms (list[Domain|Circle|str], optional) – list of geom object for mesh refinement, by default []
isOrganised (bool, optional) – mesh is organized, by default False
additionalSurfaces (list[Domain, Circle, Points, Contour]) – additional surfaces that will be added to or removed from the surfaces created by the contour and the inclusions. (e.g Domain, Circle, Contour, Points). Tip: if the mesh is not well generated, you can also give the inclusions.
additionalLines (list[Union[Line,CircleArc]]) – additional lines that will be added to the surfaces created by the contour and the inclusions. (e.g Domain, Circle, Contour, Points). WARNING: lines must be within the domain.
additionalPoints (list[Point]) – additional points that will be added to the surfaces created by the contour and the inclusions. WARNING: points must be within the domain.
folder (str, optional) – default mesh.msh folder, by default “” does not save the mesh
- Returns:
Created mesh
- Return type:
- Mesh_Revolve(inclusions=[], axis=None, angle=360, layers=[30], elemType=ElemType.TETRA4, cracks=[], refineGeoms=[], isOrganised=False, additionalSurfaces=[], additionalLines=[], additionalPoints=[], folder='')[source]#
Creates a 3D mesh by rotating a surface along an axis.
- Parameters:
inclusions (list[Domain, Circle, Points, Contour], optional) – list of hollow and filled geom objects inside the domain
axis (Line, optional) – revolution axis, by default Line((0, 0), (0, 1))
angle (float|int, optional) – revolution angle in [deg], by default 360
layers (list[int], optional) – layers in extrusion, by default [30]
elemType (ElemType, optional) – element type, by default “TETRA4” [“TETRA4”, “TETRA10”, “HEXA8”, “HEXA20”, “HEXA27”, “PRISM6”, “PRISM15”, “PRISM18”]
cracks (list[Line | Points | Contour | CircleArc]) – list of geom object used to create open or closed cracks
refineGeoms (list[Domain|Circle|str], optional) – list of geom object for mesh refinement, by default []
isOrganised (bool, optional) – mesh is organized, by default False
additionalSurfaces (list[Domain, Circle, Points, Contour]) – additional surfaces that will be added to or removed from the surfaces created by the contour and the inclusions. (e.g Domain, Circle, Contour, Points). Tip: if the mesh is not well generated, you can also give the inclusions.
additionalLines (list[Union[Line,CircleArc]]) – additional lines that will be added to the surfaces created by the contour and the inclusions. (e.g Domain, Circle, Contour, Points). WARNING: lines must be within the domain.
additionalPoints (list[Point]) – additional points that will be added to the surfaces created by the contour and the inclusions. WARNING: points must be within the domain.
folder (str, optional) – default mesh.msh folder, by default “” does not save the mesh
- Returns:
Created mesh
- Return type:
- Plot(ax=None, color='', name='', lw=None, ls=None, plotPoints=True)[source]#
Plots the geometry using Matplotlib.
- Parameters:
ax (matplotlib axis, optional) – Axis to plot on. If None, a new one is created.
color (str, optional) – Line color.
name (str, optional) – Label for the object.
lw (float, optional) – Line width.
ls (str, optional) – Line style.
plotPoints (bool, optional) – If True, display the object’s defining points.
- Returns:
The axis with the plotted geometry.
- Return type:
Axes
- static Plot_Geoms(geoms, ax=None, color='', name='', plotPoints=True, plotLegend=True)[source]#
Plots a list of geometric objects on the same axis.
- Parameters:
geoms (list of _Geom) – Geometries to plot.
ax (matplotlib axis, optional) – Axis to use. If None, a new one is created.
color (str, optional) – Line color.
name (str, optional) – Label for the geometries.
plotPoints (bool, optional) – Whether to plot defining points.
plotLegend (bool, optional) – Whether to display the legend.
- Returns:
The axis with the plotted geometries.
- Return type:
Axes
- Rotate(theta, center=(0, 0, 0), direction=(0, 0, 1))[source]#
Rotates the object coordinates around an axis.
- Parameters:
theta (float) – rotation angle in [deg]
center (tuple, optional) – rotation center, by default (0,0,0)
direction (tuple, optional) – rotation direction, by default (0,0,1)
- Return type:
None
- Symmetry(point=(0, 0, 0), n=(1, 0, 0))[source]#
Reflects the geometry with respect to a plane.
- Parameters:
point (Coords, optional) – A point on the reflection plane, by default (0, 0, 0).
n (Coords, optional) – Normal vector of the plane, by default (1, 0, 0).
- Return type:
None
- Translate(dx=0.0, dy=0.0, dz=0.0)[source]#
Translates the geometry in 3D space.
- Parameters:
dx (float, optional) – Translation along the x-axis, by default 0.0.
dy (float, optional) – Translation along the y-axis, by default 0.0.
dz (float, optional) – Translation along the z-axis, by default 0.0.
- Return type:
None
- _abc_impl = <_abc._abc_data object>#
- property coord: ndarray[tuple[Any, ...], dtype[floating]]#
Returns the coordinates of all points as a NumPy array.
-
isHollow:
bool# Indicates whether the formed geometry is hollow.
-
isOpen:
bool# Indicates whether the geometry is open, typically to model cracks.
-
meshSize:
float# Element size used for meshing.
-
name:
str# Name of the geometric object.